


 When you buy through affiliate links in our content, we may earn a commission at no extra cost to you. Learn
This month, the Bitcoin (BTC) price finally surpassed a long-awaited milestone of $100,000 and hit an all-time high of $102,524.91 on December 12, 2024.
Now that the current price has overcome the previous high of $72,000, so decisively, has BTC reached a ceiling, or should we expect new records in 2025? And why have Bitcoin prices over the years been so volatile in the past, and what does its year-to-date gain of more than 127% indicate about its potential targets in the future?
In this article, we look at Bitcoin’s evolution in the years since its launch and where the market may be heading next.
Key Takeaways
- Bitcoin’s recent surge to an all-time high of over $100,000 continues a pattern of post-halving rallies.
- The rise in Bitcoin’s value underscores the cryptocurrency’s increased adoption by retail and institutional investors.
- Historical price data indicates that Bitcoin is likely to experience heightened volatility in the near term.
- Profit-taking, corrections, and market sentiment shifts can lead to sharp BTC price swings.
- Observers have an eye on potential moves by the incoming Trump administration to create a more favorable environment for cryptocurrency investment, adoption and innovation in the US.
- Rising investment demand and increased adoption make many analysts optimistic about Bitcoin’s potential for future value growth.
Bitcoin Price History Over Its 15 Years
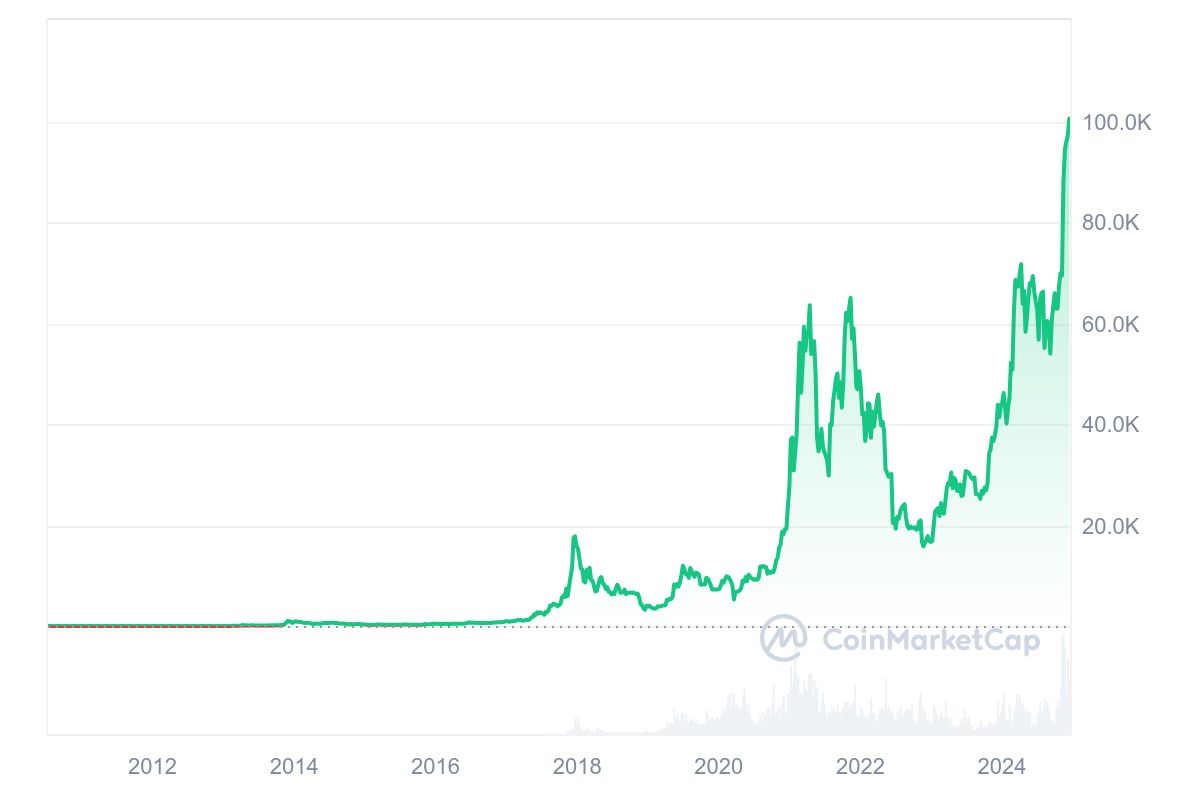
Bitcoin’s price history by year demonstrates the market’s high volatility.
The leading cryptocurrency has rebounded from a low of around $16,000 in November 2022—right on time with its four-year post-halving cycles.
Bitcoin price history over its 15 years in existence shows that the value of the cryptocurrency tends to climb several months after the rate of new coin supply is cut in half. Bitcoin’s latest rally to an all-time high of over $100,000 continues a pattern of post-halving uptrends.
2024: A Fresh $100K ATH as New Post-Halving Cycle Begins
Bitcoin started 2024 at around $42,000, having more than doubled from a year earlier, as the first Bitcoin spot exchange-traded funds (ETFs) were approved in January, and investors anticipated the fourth halving in April 2024.
Halving—which is scheduled to occur roughly every four years—reduces the reward that miners receive for processing transactions and creating new blocks on the Bitcoin blockchain by 50%, bringing the reward down from 6.25BTC to 3.125BTC this year.
BTC’s historical price analysis shows that Bitcoin tends to trade within a range for more than 100 days following a halving, which makes a parabolic run higher. The 180-day post-halving period ended in late October, and then Bitcoin rallied as anticipated in early November.
The BTC price has rallied by more than 25% since the election of former President Donald Trump on November 5. The incoming administration is seen as more friendly to cryptocurrency than the Joe Biden-Kamala Harris administration, and a Harris administration would have been.
That is in part because Tesla CEO and cryptocurrency enthusiast Elon Musk has become a key advisor to Trump, and Trump has suggested that the new administration will implement crypto-friendly policies such as creating a national strategic Bitcoin reserve and appointing favorable financial regulators.
2023: Bitcoin Emerges from Bear Market Ahead of Spot ETFs
The price of BTC climbed by over 150% as the bear market came to an end. The market began to recover in the first quarter, rising from around $16,500 to $24,500, but remained volatile as crypto-friendly traditional financial institutions such as Silicon Valley Bank and Silvergate Capital collapsed owing to liquidity issues, leaving investors in risk-off mode.
Bitcoin’s value briefly dropped back to the $20,000 level but again rebounded after BlackRock, the world’s largest asset management firm, filed to introduce a spot Bitcoin ETF in the US. Regulators had previously rejected spot ETF applications, but BlackRock’s arrival was expected to bring a new level of institutional investment into the market.
As the approval approached at the end of the year, Bitcoin surpassed $44,000 in December, the highest level in BTC price history since early 2022.
2022: Crypto Winter Arrives
After reaching an all-time high of over $68,000 in November 2021, Bitcoin price analysis shows that the coin defied bullish predictions for it to continue on to the $100,000 level and began to decline sharply, dropping below $50,000.
As the US Federal Reserve began increasing interest rates early in the year, the value of the US dollar rose, and sentiment towards technology equities turned negative; investments in Bitcoin also came under pressure.
The collapse of the Terra Luna stablecoin ecosystem in May further shook confidence in cryptocurrencies, pulling the Bitcoin price down from around $39,000 to $20,000.
The market was deeply into a period of bearish sentiment known as a “crypto winter.” While the market turned higher to $22,000, the collapse of the influential FTX cryptocurrency exchange in November 2022 again damaged sentiment and sent the Bitcoin chart below $16,000—its lowest level since November 2020.
2021: Market Explodes to All-Time High
Following the third block reward halving in 2020, the Bitcoin price gradually trended higher until it took off to new highs in 2021. Supported by bullish sentiment from Covid-2019 related economic stimulus, interest in Bitcoin increased.
The price started the year at $29,000 and, within days, had climbed above $40,000. It then hit $40,000 in February and a high of $60,000 in March.
After a selloff triggered by profit-taking and concerns that the cryptocurrency market was in a speculative bubble, the price dropped below $34,000 in May. But it soon regained its momentum and reached a new all-time high above $68,000 in November.
The first Bitcoin futures ETF, ProShares Bitcoin Strategy (BITO), was launched in October, indicating that crypto had gained the attention of institutional investors and moved beyond early enthusiasts.
2020: Halving Touches Off Next Bull Run
Eyes were on the Bitcoin price performance in early 2020 as the halving approached, with investors anticipating the start of a new bullish cycle. However, stock market volatility associated with the Covid-19 pandemic affected sentiment on the cryptocurrency market, and Bitcoin crashed by 50% over two days in March to $4,000. Like other markets, Bitcoin soon rebounded and more than doubled.
After the halving in May, the Bitcoin price ranged between $9,000 and $11,000 for 150 days before taking off after 180 days. It broke out in October, more than doubling again to end the year at $29,000—proving that the pattern of a post-halving rally in the Bitcoin price over time remained intact.
Bitcoin Price History: First 10 Years
Over its first decade, Bitcoin’s price history demonstrated extreme volatility as it gained traction beyond a niche community of cryptocurrency developers. The groundwork was laid for cryptocurrency to become a speculative new asset class.
Bitcoin was launched in 2009 by an anonymous individual or group of individuals under the pseudonym Satoshi Nakamoto. At launch, the new digital currency had no value.
Bitcoin’s full price history goes back to 2010. The first known commercial transaction to use Bitcoin as a medium of exchange took place that year when a user purchased two pizzas for 10,000 BTC, which at the time would have been worth a total of $41.
By February 2011, BTC reached parity with the US dollar, meaning the 10,000 Bitcoin was then worth $10,000.
Historical bitcoin prices show that the first BTC boom and bust cycle happened in 2011 when the price climbed to $31 in June and subsequently collapsed to $2 in November. In 2012, the price moved up to a high of $13, and more Bitcoin exchanges began to emerge, making it easier to buy and sell.
The first Bitcoin halving occurred in November 2012, and the following year saw Bitcoin establish its post-halving bull run, soaring from around $13 in January to over $1,100 at the end of 2013. At this stage, the extreme volatility in Bitcoin’s value history began to attract media attention and growing public interest.
Around this time, developers began to launch alternative cryptocurrencies, known as altcoins. Ethereum (ETH), the biggest altcoin by market cap, was conceived in 2013 and launched in 2015.
The bull run ended in 2014, as the bankruptcy of the Mt Gox exchange soared sentiment. The Bitcoin price had ended the year at around $315.
The Bitcoin price history chart shows that it began to gain value again in 2016, driven by the second halving in July and growing awareness of the potential for large profits from its sharp price swings. The price ended the year just under $1,000 and then soared during 2017, in line with the post-Bitcoin halving price history, to peak close to $20,000 in December 2017.
That cycle came to an end in 2018, with the price steadily declining to around $3,200 by the end of the year. The price again began to recover in 2019, rebounding above $7,000 as interest in cryptocurrencies continued to grow.
Where Next?
| Analyst | Year | Bitcoin Price Target |
|---|---|---|
| QCP Capital | 2024 | $97,000 |
| Standard Chartered (Geoff Kendrick) | 2024 | $125,000 |
| Standard Chartered (Geoff Kendrick) | 2025 | $200,000 |
| Bernstein | 2025 | $200,000 |
| Anndy Lian | 2025 | $100,000 |
| Anndy Lian | 2026 | $120,000-$150,00 |
| Anndy Lian | 2030 | $200,000 |
| Cathie Wood (Ark Investment) | 2030 | $3.8 million |
The Bitcoin lifetime chart indicates that there is more potential for upside as the latest post-halving price cycle continues.
Singapore-based digital asset manager QCP Capital noted on November 12 that Bitcoin is gaining traction as “digital gold,” a trend that “appears increasingly structural, with capital reallocating from traditional safe havens like gold into BTC.”
Based on a comparison with gold, Bitcoin’s market cap history points to further price gains. The market cap, now around $1.75 trillion, recently edged out silver’s $1.72 trillion market cap but remains at a fraction of gold’s $17.5 trillion. “If even 1% of capital from gold were to flow into BTC, it could propel Bitcoin to around $97k, highlighting the potential upside as this narrative continues to solidify,” according to QCP’s analysis.
“With BTC just below the critical $90k level, the end-November basis has surged to over 18%, accompanied by strong interest in far-out calls at 110k and 120k strikes. This trend points to heightened demand for margin and leverage as investors position for further breakout potential,” QCP added.
UK bank Standard Chartered recently reiterated its bullish Bitcoin outlook, with Geoff Kendrick, Global Head of Digital Assets Research, predicting the price will reach $125,000 by the end of 2024 and $200,000 by the end of 2025.
Analysts at Bernstein have similarly stated:
“The Bitcoin genie is out of the bottle, and it is hard to reverse this course. Our Bitcoin price target for the end of 2025 remains $200,000 independent of the election outcome.”
Anndy Lian, an Intergovernmental Blockchain Expert, said that predicting the future prices of cryptocurrencies like Bitcoin (BTC) is challenging due to their volatility and dependence on market trends, adoption, and regulatory developments.
However, drawing some insights based on current bullish trends and historical performance, Lian told Techopedia:
Meanwhile, Cathie Wood, head of Ark Investment Management, has long been among the most bullish crypto observers and has stated that she believes Bitcoin could reach $3.8 million by 2030—well above her own firm’s already bullish prediction of $1.5 million.
The Bottom Line
Bitcoin’s price history by year indicates that the cryptocurrency is attracting growing investor confidence and increasing mainstream adoption, as each four-year halving cycle reduces new supply while demand continues rising.
The Bitcoin price today of $100,380.77 reflects strong bullish sentiment but is also a reminder of the cryptocurrency’s inherent volatility, as it started 2024 around $42,000.
Looking ahead, market analysts remain divided: some predict further price surges to at least 125,000 as institutional interest grows and new financial products like Bitcoin ETFs gain traction, while others caution about potential regulatory headwinds and market corrections.
For investors, the new all-time high is a reminder that cryptocurrencies like Bitcoin offer exciting opportunities but require a balanced approach with an informed, long-term perspective.