

 When you buy through affiliate links in our content, we may earn a commission at no extra cost to you. Learn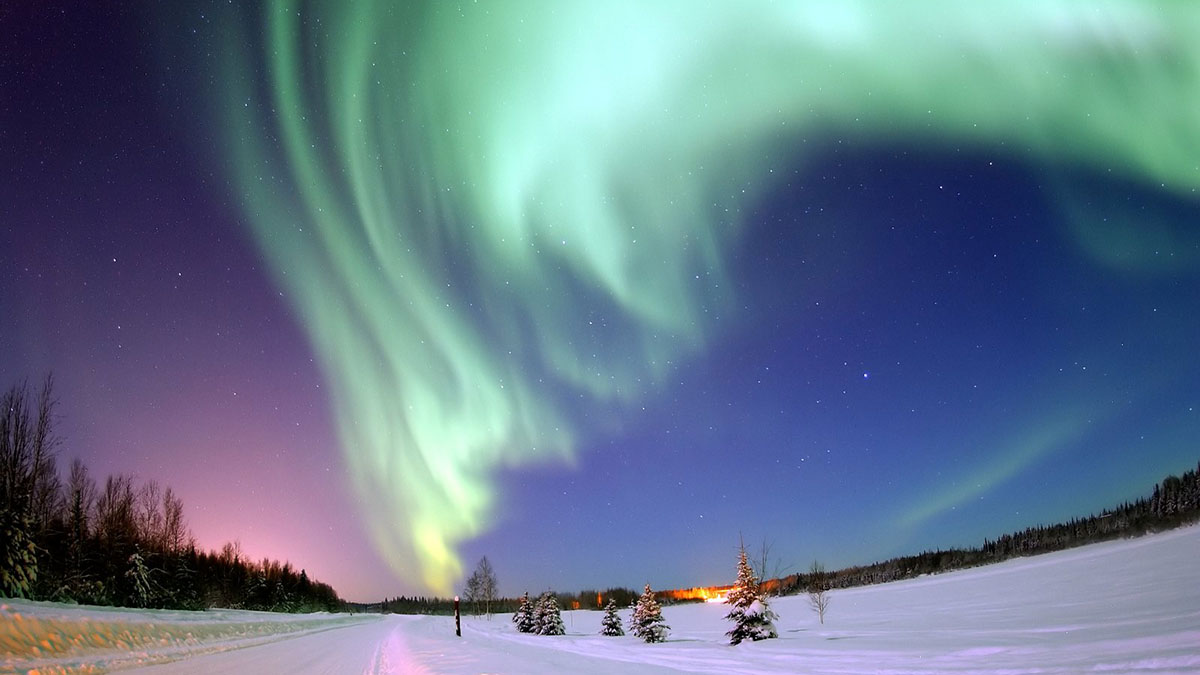
Unless you live above the Arctic Circle, chances to see the Northern Lights are few and far between, but a new website aims to improve your odds. A group of Chinese researchers developed the tool they call Aurora Hunter using a two-stage AI model to forecast when an aurora is both likely to occur and visible from the ground.
The team’s skillset includes optical engineering, physics, instrumentation research, and computer science. The website is live and free to use, and the researchers have submitted a paper on their methodology to Cornell University’s arXiv repository.
Aurora Hunter is the sort of hyper-specialized tool that is becoming easier to produce in the era of machine intelligence. Being able to forecast the optimal viewing windows is useful to both tourists and astronomy researchers. However, it’s still a sufficiently niche application that no one might have put in the statistical work necessary for such a tool using traditional methods.
Users can search by city or input latitude and longitude. The tool will then present a percentage chance of a visible aurora, accompanied by a one-, six-, 24- or 48-hour graph. The aurora borealis being the elusive phenomenon it is, that chance will be 0% in most places at most times. However, a series of polar heatmaps at the bottom of the page show you where you would have to be to have a chance.
At the moment, for instance, your best chance would be to be a seabird on Russia’s otherwise uninhabited Yuzhny Island.
The tool currently only provides odds for the aurora borealis, so Southern Hemisphere residents are out of luck unless a future update includes the aurora australis.
Forecasting Space Weather and Terrestrial Weather at Once
For an aurora to be visible, a few things need to be true. Weather conditions in space need to be right to create the lightshow in the first place. Then, the skies need to be clear enough not to obstruct the view, and the Moon needs not to be drowning the aurora out with its own light.
Aurora Hunter separates the aurora component from the visibility component, calculates each probability separately, then multiplies them together to get your overall odds. Helpfully, it graphs both components as well, so you can tell if it might be worth relocating for a better view, or if there’s nothing to see in the first place.
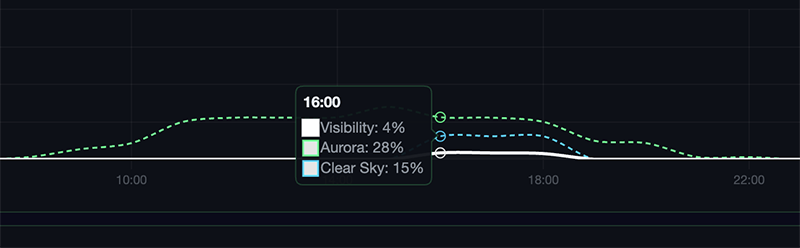
Each probability is calculated using an AI model trained on actual nighttime sky photographs paired with terrestrial and space weather data. In other words, it’s forecasting visibility based on empirical data for the specific phenomenon, rather than relying on general-purpose meteorological metrics like percentage cloud cover.
As for the aurora itself, the daily space weather data being used is listed on the page above the forecasted sighting probability. These include:
- KP Index: A measure of geomagnetic storm intensity.
- BZ (IMF) and DST Index: Measures of electromagnetic field strength in the interplanetary medium and the Earth’s equatorial ring current.
- Solar wind velocity: How fast high-energy particles from the Sun are coming in before they hit the magnetosphere.
- Proton density: How many of those particles there are per cubic centimeter at the moment.
Also in Science News
Chatbots are Advancing the Field of Mathematics
Large language models are better at some tasks than others, but one of the things they seem to do well at is mathematical research. Last week, OpenAI bragged that one of its cutting-edge models — not yet available to the public — had disproven the prevailing wisdom about a famous problem in combinatorial geometry.
The problem, in a nutshell, is if you’re given N dots and the freedom to place them however you like, what is the maximum number of straight lines you can draw between any two points that all have the same length? The most obvious thing to try is to place the dots in a perfectly square grid, but it turns out that you can improve on that by pinching the sides of the grid in ever-so-slightly.
However, the AI managed to use math from a different field entirely — algebraic number theory — to prove that human mathematicians were barking up the wrong tree by deforming grids, and that even better solutions exist that break out of that mold.
Even out “in the wild,” more and more mathematics papers are being published that used AI help in generating the proof or as a sounding board for the human mathematicians to riff on their ideas. That may seem somewhat surprising given that LLMs have famously struggled to count the number of Rs in “strawberry,” but the rigid syntax of mathematical language works in the models’ favor.
‘Butterfly Molecule’ Completes the ‘Quantum Zoo’
Physicists have produced the “butterfly” that was the last of a set of exotic and formerly hypothetical nanoscale structures called Rydberg molecules. These molecules are fragile, but gigantic in atomic terms, and can exist only at temperatures very close to absolute zero.
Rydberg atoms are ones in which one of the outer electrons has been given enough energy to move out into a much wider orbital than it would normally occupy. If that atom then bonds with another, normal atom, you get a molecule with considerably more distance between the atoms than would be possible under normal conditions. Low-temperature physicists predicted a limited set of configurations in which this would be possible, which Phys.org describes as a “quantum zoo.” The butterfly shape proved to be the hardest to produce in practice, but after 20 years, the zoo is complete.
As with a lot of advanced physics, the value of creating the molecule lies largely in proving the validity of the model that predicted it. However, Rydberg molecules are hyper-sensitive to electric fields because of their long bonds, which could lead to practical applications somewhere down the line.
Game Theory Explores the Rare Phenomenon of Political Party Reversals
Political parties shift their platforms over time, but it’s very rare that two will trade positions entirely on an issue. Rare, and yet, it does happen. Most famous, perhaps, is the do-si-do on race issues executed by the U.S. Democratic and Republican parties in the early 20th century.
To investigate why that happens, a pair of Indian economists are turning the question around and asking what game theory assumptions one needs to make in order for it not to be a possibility. Interestingly, one result of their modeling is that the option for voters to abstain seems important. That is, if voters who don’t feel satisfied by either party cannot choose to vote for no one, then, in theory, reversals should never happen.
In practice, the circumstances that lead to reversals are quite specific to their political environments and involve policies that aren’t neatly quantifiable on a single axis. In the U.S. example, Republicans were historically the party of urban industry, and Democrats of rural, agricultural interests. That led the Democrats to side with plantation owners on the issue of slavery in the 19th century, but with unions during the Great Depression, while Republicans sided with capital. The New Deal brought minorities into alignment with the Democrats for economic reasons, ceding the politics of segregation to Republicans during the Civil Rights era, a few decades later.
Image Credit: Jim Trodel via Flickr (license)