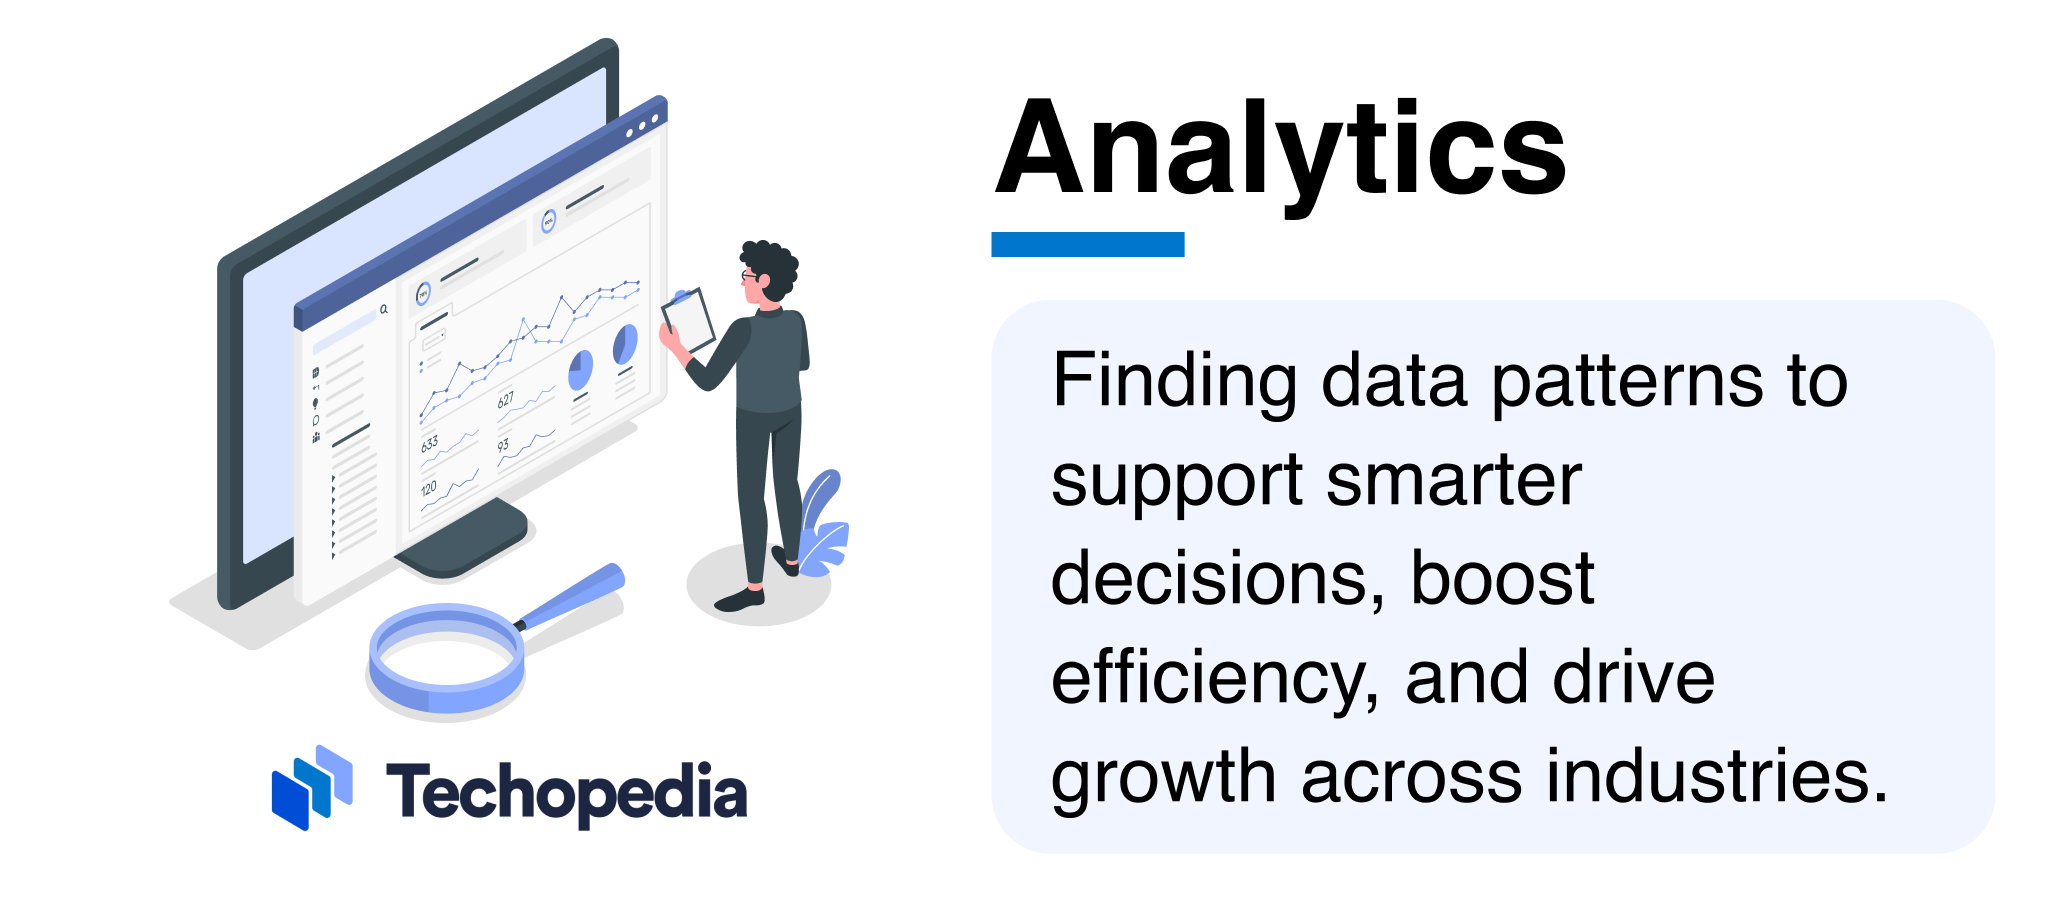
What is Analytics?
Analytics is the scientific process of finding and sharing patterns within data.
It turns raw information into insights that help people make better decisions. Analytics uses statistics, computer programming, and operations research to measure and understand data, which makes it especially useful in areas that gather large amounts of information, such as business, healthcare, sports, and science.
In short, answering what is analytics reveals how essential it is in helping organizations get value from data every day.
Key Takeaways
- Analytics finds patterns in data to help make better decisions in areas like business, healthcare, and science.
- Important steps in analytics history include the creation of bar charts, the tabulating machine, SQL, and data warehouses.
- The four types of analytics – descriptive, diagnostic, predictive, and prescriptive – help us define analytics as a way to understand past trends and guide future strategies.
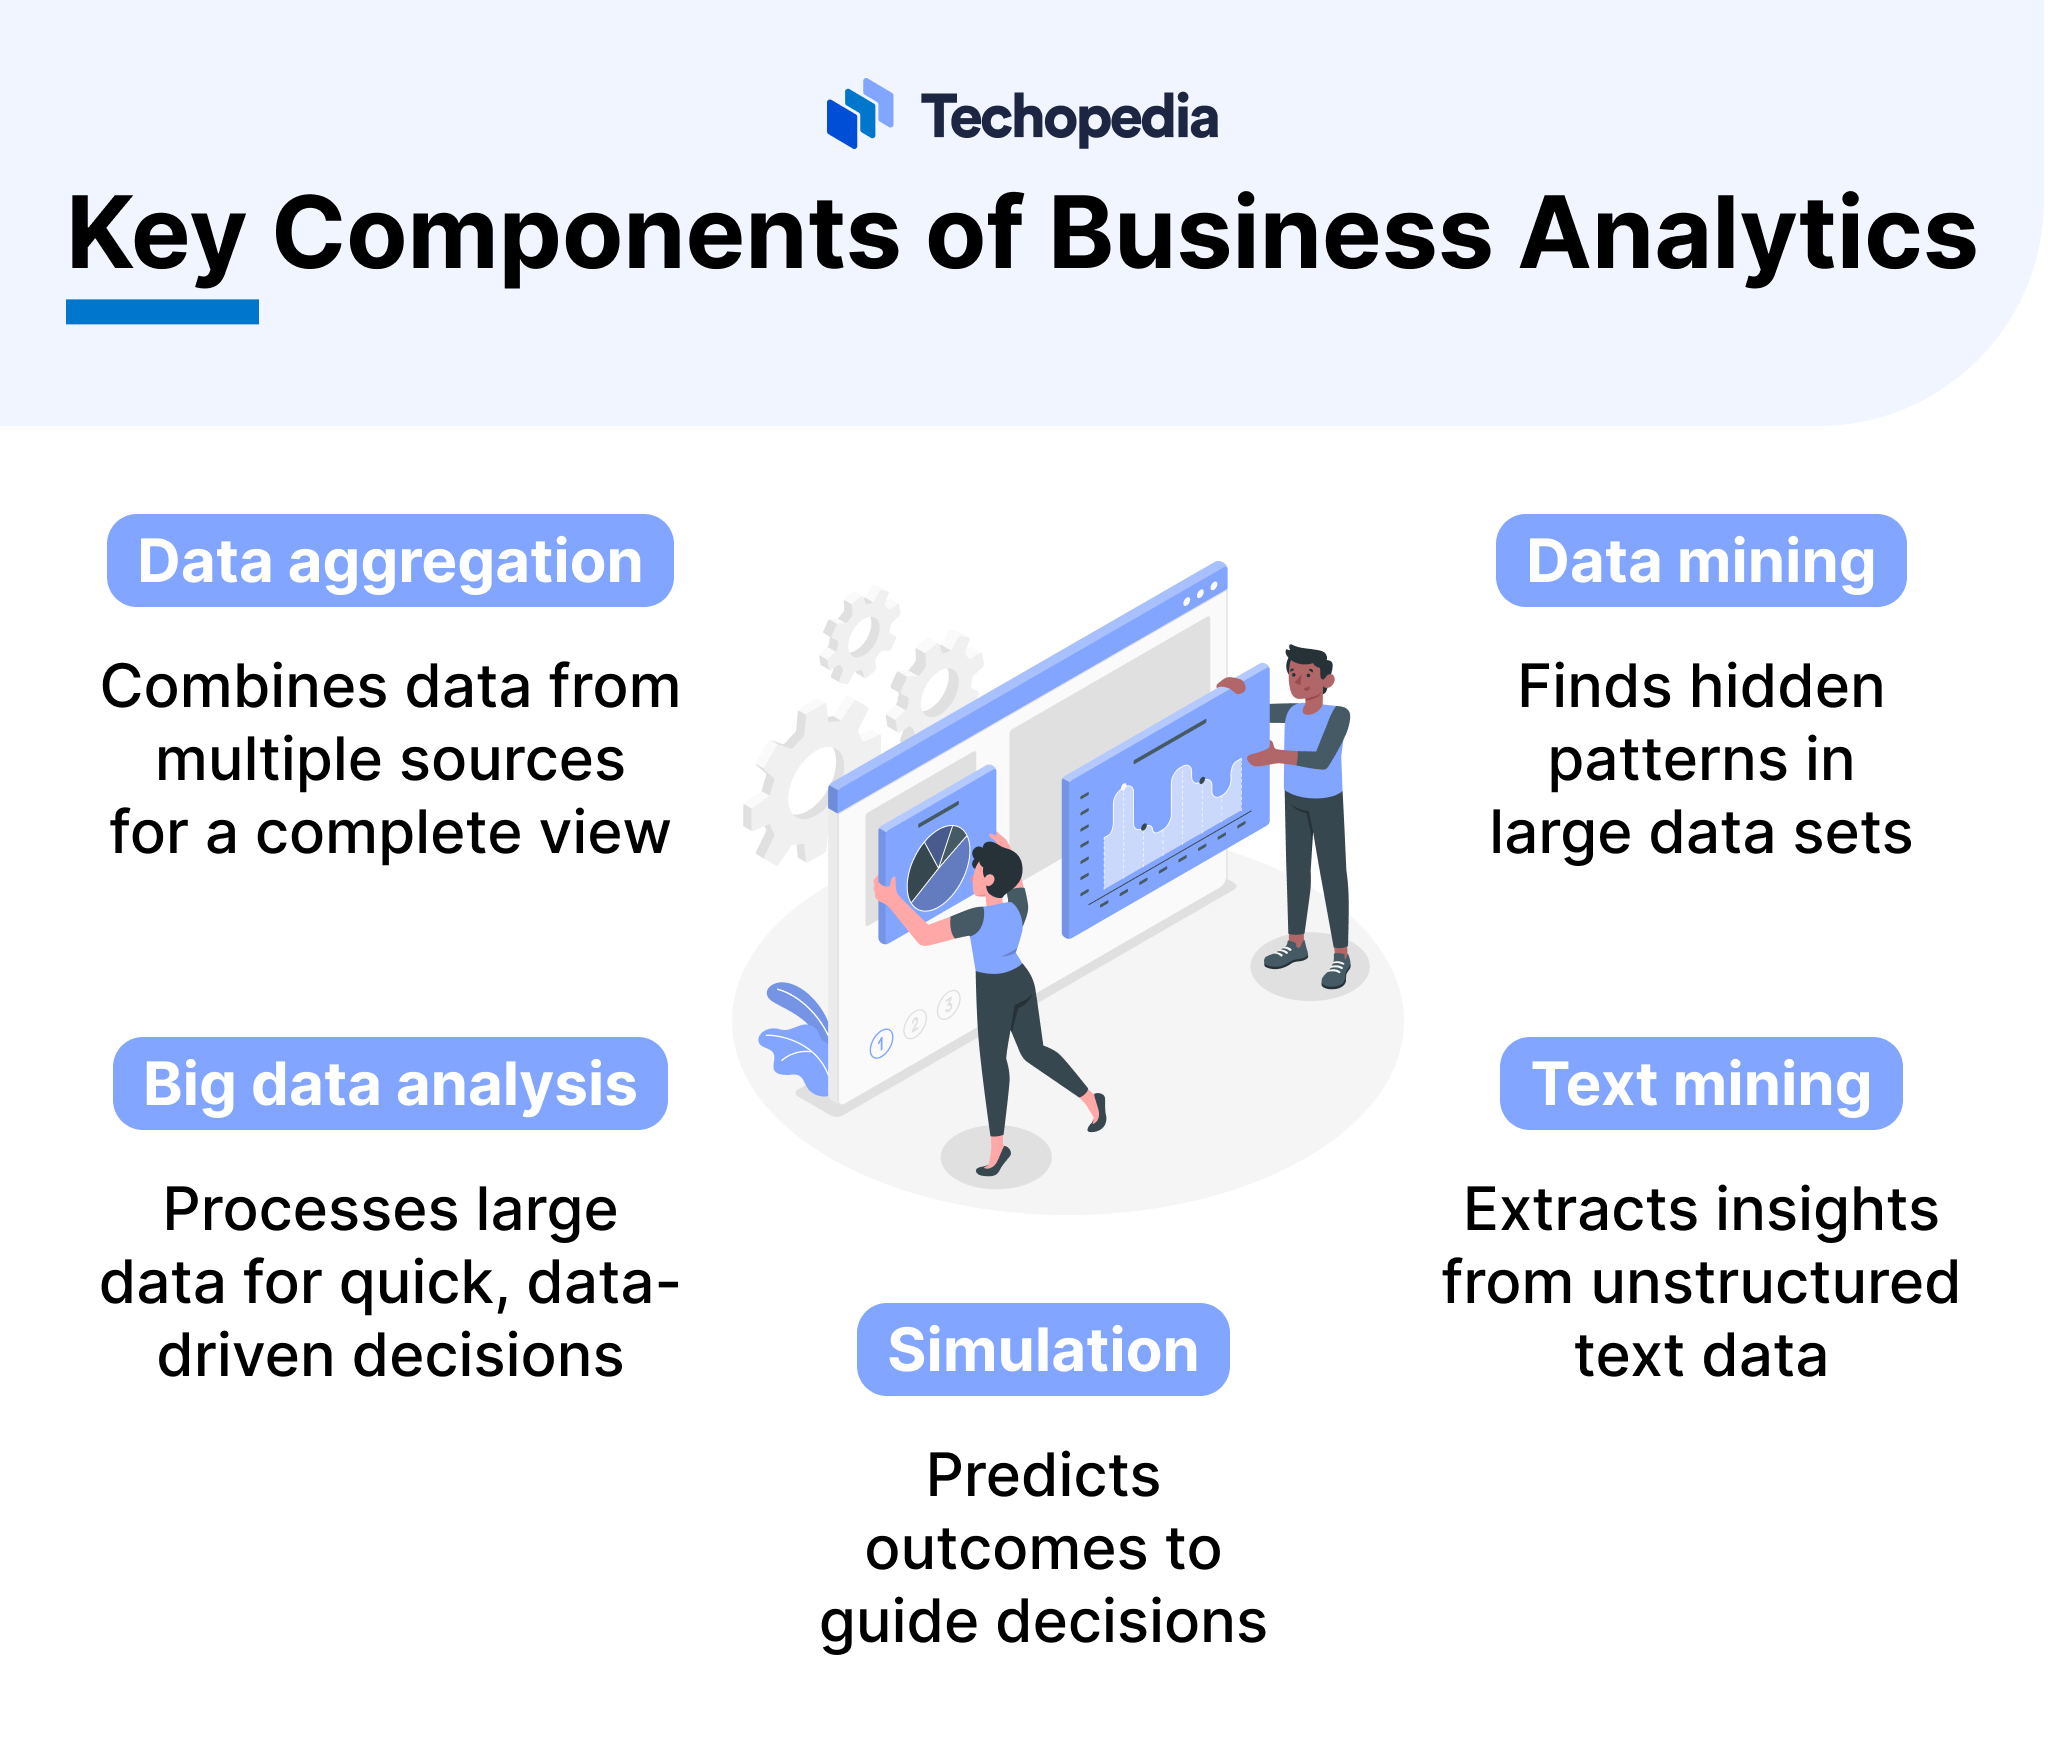
- Tools like data aggregation, data mining, big data analysis, text mining, and simulation reveal valuable insights.
- Analytics is used in website tracking, fraud detection, CRM, risk analysis, and targeted marketing, among others.
History of Analytics
The history of analytics goes back hundreds of years, beginning with simple ways to interpret data.
Analytics Today
Analytics explained today goes beyond data interpretation, thanks to new trends such as the use of artificial intelligence (AI), machine learning (ML), and cloud technology. These tools allow companies to gather, analyze, and use data in real time, making business analytics more accessible and useful across many industries.
With AI and ML, analytics can find patterns, predict outcomes, and give insights that help businesses make faster, smarter decisions.
Automation is also key, helping companies reduce manual work and improve efficiency. For instance, customer relationship management (CRM) systems now use analytics to personalize customer interactions, allowing businesses to predict customer needs and improve satisfaction.
Cloud technology has also changed how we define analytics by letting organizations store huge amounts of data and access it anytime, anywhere. This is especially important in areas like finance, where real-time data helps with risk management and fraud detection, and in marketing, where analytics allows companies to track campaigns, target the right audiences, and adjust strategies.
How Analytics Works
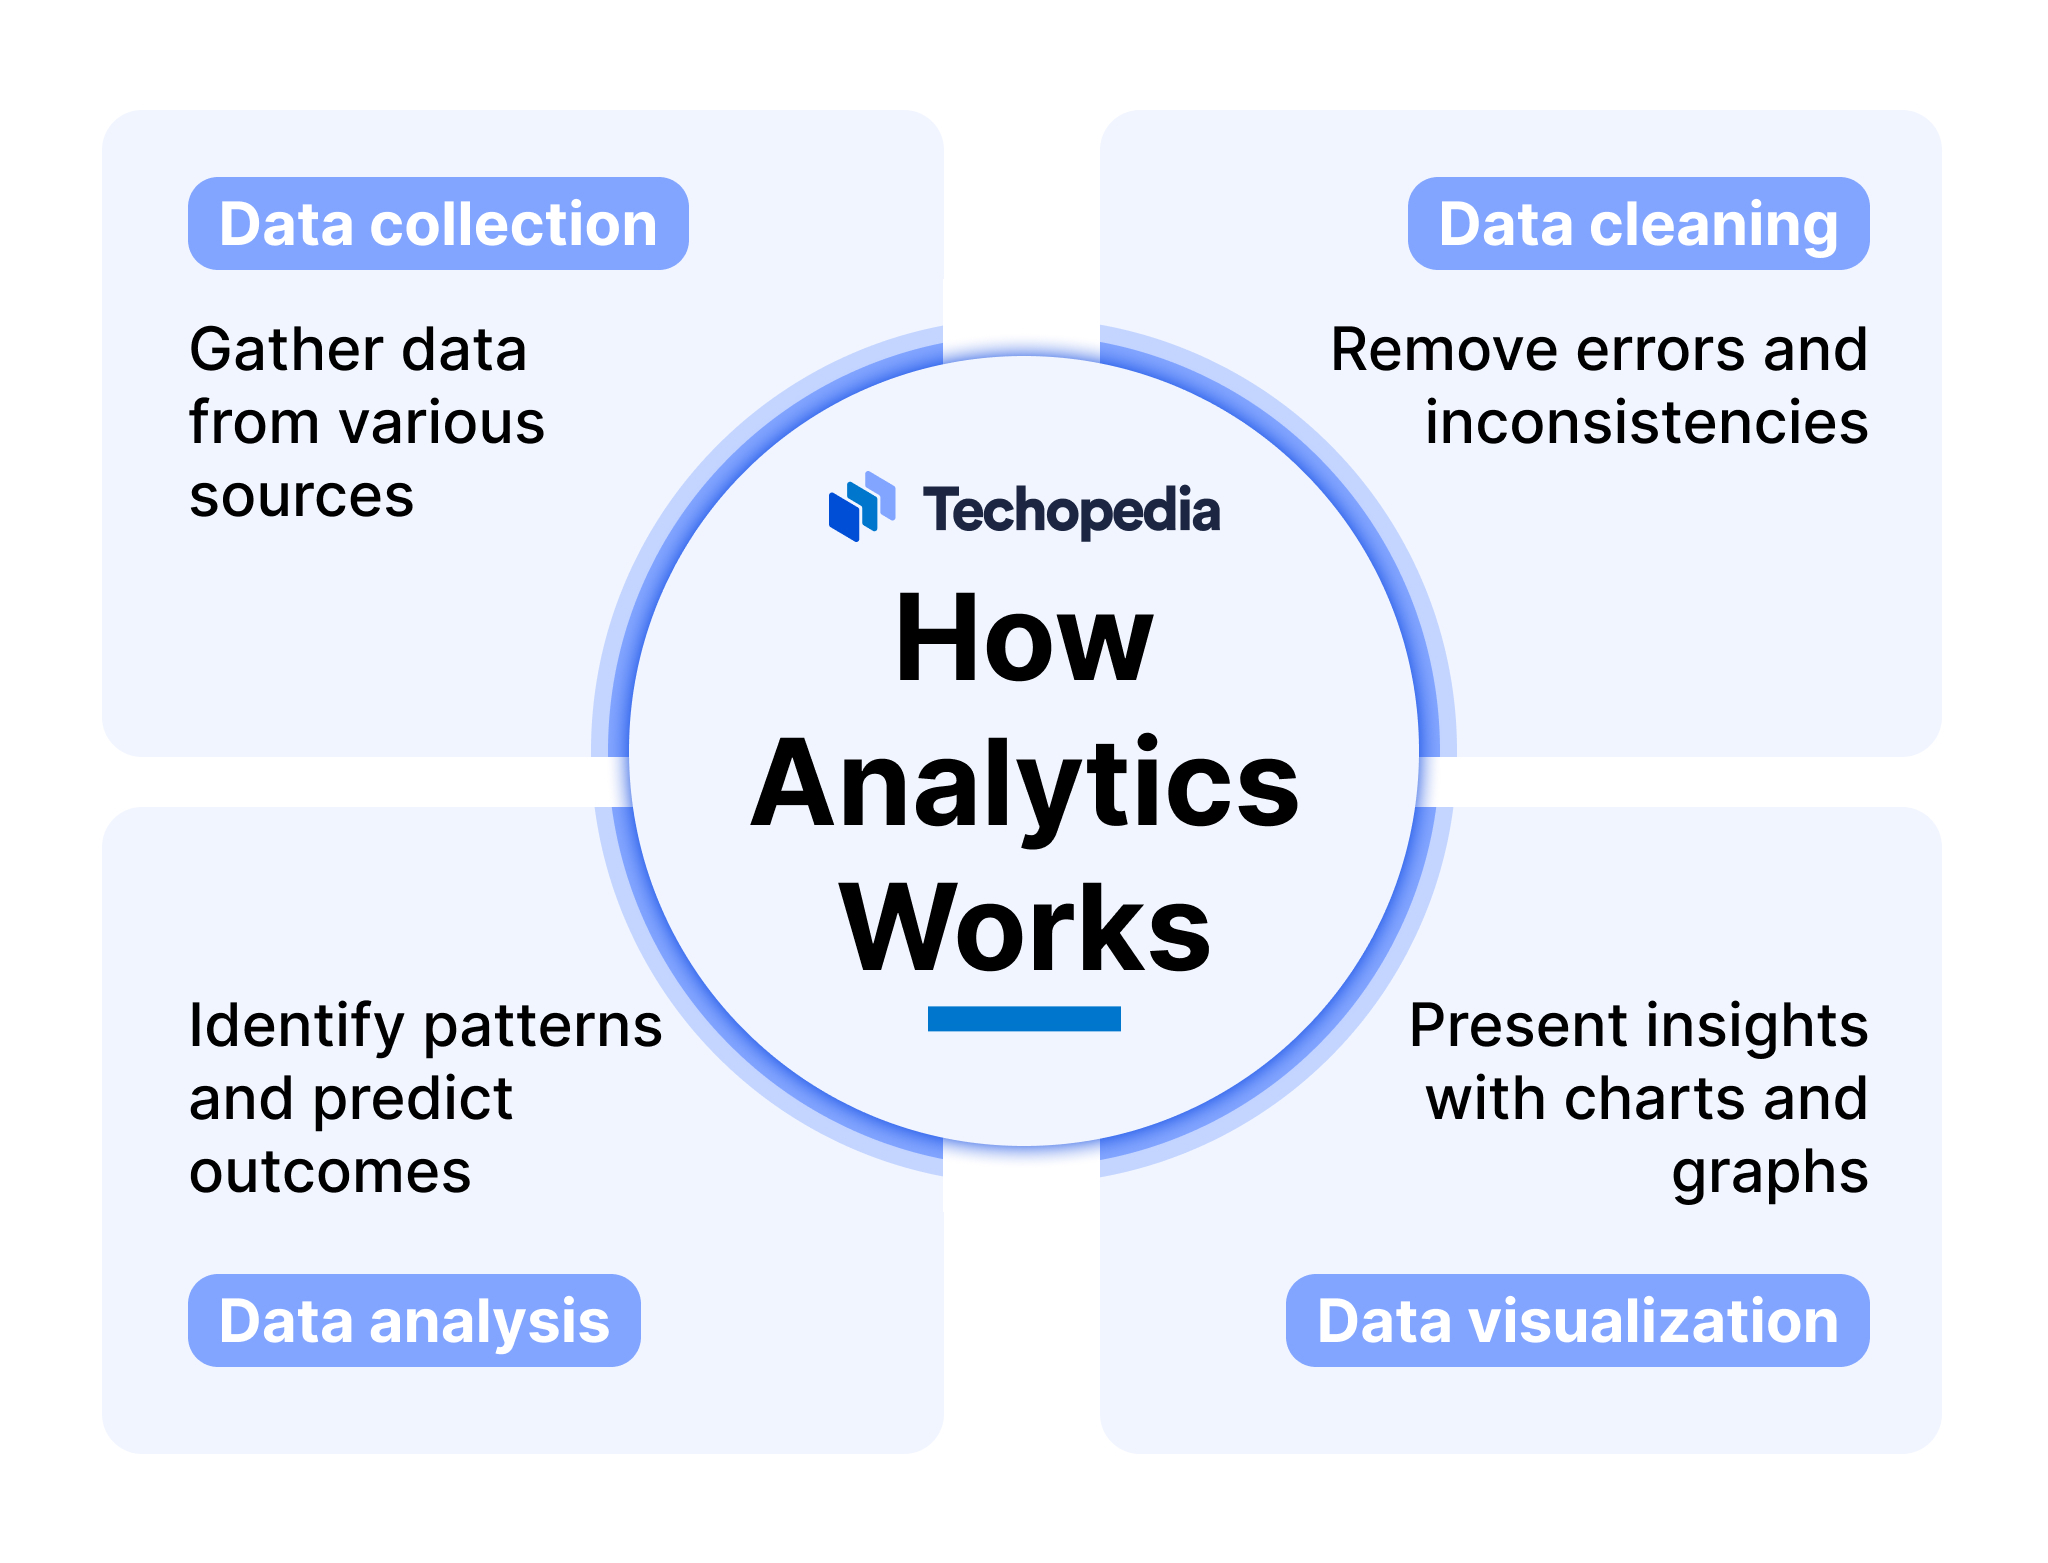
Analytics is a structured process that turns raw data into useful insights through a few important steps:
Data collection
Data is gathered from different sources like databases, social media, and IoT devices, giving a strong base for analysis.
Data cleaning
To make sure the data is accurate, errors, duplicates, and inconsistencies are removed, preparing it for reliable use.
Data analysis
Analysis uses statistical tools and ML to find patterns and trends. This step helps predict future outcomes and guides decision-making.
Data visualization
This presents the results through charts, graphs, and dashboards, making complex insights easy to understand and act on.
These analytics fundamentals show how each step works together to turn data into insights, helping businesses make informed decisions and improve strategies.
Types of Analytics
Analytics includes four main types, each with a specific purpose:
- Descriptive analytics: Answers “What happened?” by looking at past data.
- Diagnostic analytics: Answers “Why did it happen?” by finding causes and connections.
- Predictive analytics: Predicts “What will likely happen?” using statistical models.
- Prescriptive analytics: Answers “What action should we take?” by suggesting possible actions and their outcomes.
These types together help define what analytics is, offering a full view from understanding past data to shaping future strategies.
Common Components of Business Analytics
Business analytics uses several important tools and techniques to find insights and help companies make decisions.
As analytics trends evolve, it’s important to identify components that are essential for deeper insights:
This combines data from different sources into one data set, giving a complete view and helping to identify patterns and trends.
Data mining analyzes large data sets to find hidden patterns and connections. This technique reveals trends that might not be obvious at first glance.
This handles huge amounts of both structured and unstructured data, often with the help of advanced analytics and ML. It allows businesses to make fast, data-based decisions.
Text mining examines unstructured text data, such as emails and social media posts, to find insights that add detail to business analytics.
Simulation tests different scenarios to predict outcomes, helping companies make informed strategic choices.
Analytics Examples
In the business world, organizations often use analytics to describe, predict, and improve their overall performance.
Analytics is especially helpful in areas like:
Analytics Pros and Cons
Staying aware of analytics trends helps companies avoid common pitfalls and maximize the benefits of their data strategies.
Here are the key benefits and drawbacks:
Pros
- Data-driven insights improve decision-making
- Automation increases productivity by reducing manual tasks
- Analytics enable better customer personalization and engagement
- Analytics help identify risks early and develop mitigation strategies
Cons
- Poor data quality can lead to misleading insights
- Customer data collection raises privacy concerns
- Advanced analytics systems can be costly for small businesses
- Effective use of analytics requires specialized skills
The Bottom Line
The analytics definition goes beyond basic data analysis – it is a powerful tool that helps businesses make smarter decisions, improve efficiency, and react to trends. By finding insights into large amounts of data, analytics supports better strategies in fields like finance and marketing.
However, companies should also be aware of challenges, such as data quality and privacy, to fully benefit from analytics.