
Bitcoin mining’s energy consumption is a highly controversial topic that has sparked the ire of environmentalists and lawmakers. On the other side of the spectrum are cryptocurrency believers and Bitcoin enthusiasts who will tell you that the Bitcoin blockchain’s impregnable security is derived from its energy consumption.
If you are interested in understanding why Bitcoin mining uses so much energy and how the Bitcoin mining energy consumption stats have changed over the recent years, we have compiled comprehensive Bitcoin mining and energy consumption statistics for 2026.
Key Takeaways
- Bitcoin’s daily power demand was estimated at about 20.15 gigawatt hours (GWH) as of November 20, 2024, which accounts for an annualized estimate of 176.62 TWh.
- The US was the largest Bitcoin mining industry globally in 2024, representing over 37.8% of the global Bitcoin network’s hash rate.
- The US overtook China as the top Bitcoin mining nation following the crackdown on the Bitcoin mining industry in China in mid-2021.
- The high cost associated with Bitcoin mining prevents blockchain vulnerabilities like Sybil attacks and 51% attacks.
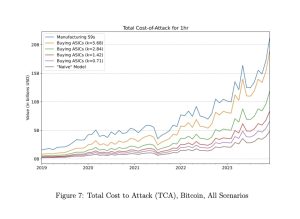
- The most recent research estimated that it will cost over $20 billion per hour to attack Bitcoin.
- Studies have shown that Bitcoin’s annual energy consumption is estimated to be more than that of several nations, including Poland, Egypt, and Malaysia.
- Coal’s share in Bitcoin’s energy mix has decreased over the years.
- Texas was the top Bitcoin-producing state in the US in 2023.
Why Does Bitcoin Mining Consume So Much Energy?
Bitcoin is a decentralized payment network that does not have any central authority to check, validate or censor transactions. In order to prevent fraudulent transactions, Bitcoin conducts a cryptographic function called proof-of-work (PoW) to validate transactions and to ensure that all network participants agree on the current state of the ledger.
PoW is a costly process that requires miners to invest in computing hardware and expend electrical energy. Only people who invest in the process get the chance to change the state of the Bitcoin ledger. As an incentive for honest work, miners are rewarded newly-minted Bitcoins every time they add a new block to the Bitcoin ledger.
The high cost associated with Bitcoin mining prevents blockchain vulnerabilities like Sybil attacks and 51% attacks. A Sybil attack occurs when an attacker creates multiple fake identities to gain control of a network. A 51% attack occurs when a single entity gains control of more than 51% of a network’s computational power.
What Is the Cost of Attacking Bitcoin?
According to a February 2024 research report by Lucas Nuzzi, Kyle Waters and Matias Andrade, it will cost over $20 billion to conduct a 51% attack on Bitcoin for one hour using the Bitmain S9 mining rigs, which was one of the most popular mining rigs at the time of writing.
The high cost of acquiring mining rigs and expending electrical energy required in Bitcoin mining makes it theoretically unprofitable to conduct 51% of attacks on Bitcoin.
How Much Energy Does Bitcoin Mining Use?
Now that we understand that Bitcoin is designed to consume electricity for security let’s learn about the amount of energy Bitcoin mining consumes. Note that the Bitcoin mining energy consumption stats are estimates calculated by research firms.
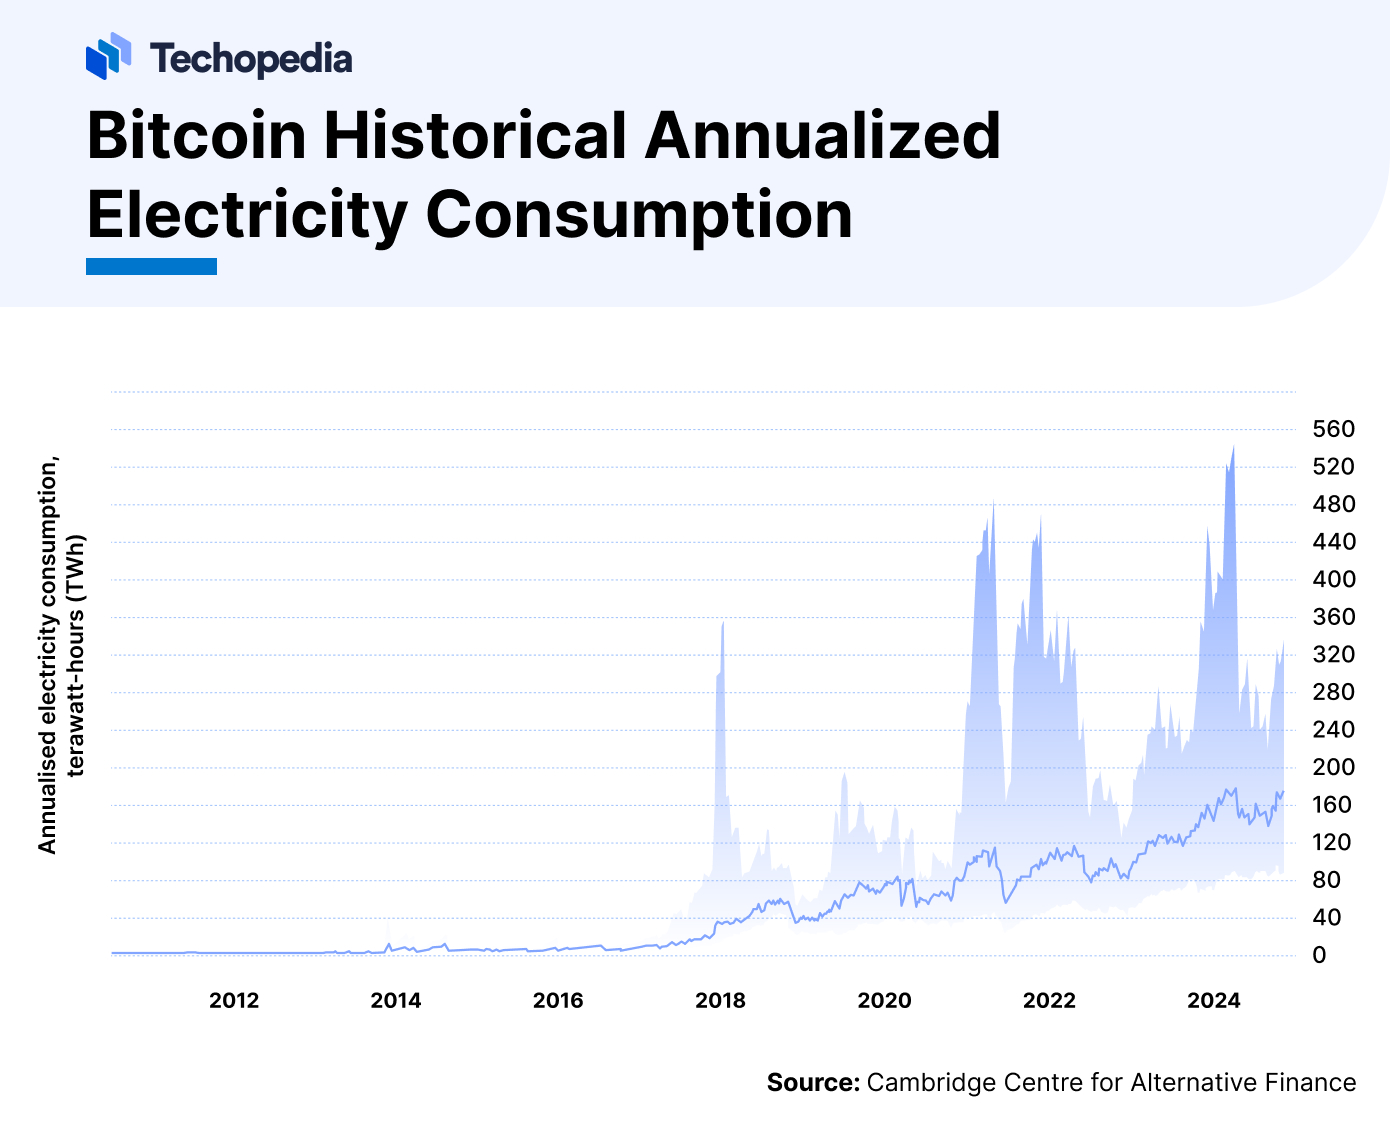
How much electricity does Bitcoin mining use per day? According to the Cambridge Bitcoin Electricity Consumption Index, Bitcoin’s daily power demand was estimated at about 20.15 gigawatt hours (GWH) as of November 20, 2024.
Note that the daily figure keeps changing based on various factors, including BTC prices, hash rate, equipment used and energy prices.
Bitcoin’s annualized energy consumption was estimated at 176.62 terawatt hours (TWH) as of November 20, 2024, which was more than the annual energy consumption of several nations, including Egypt, Malaysia and Poland, according to Cambridge Centre for Alternative Finance.
Cambridge Centre for Alternative Finance’s Bitcoin energy consumption chart showed that annualized electricity consumption, calculated on a seven-day moving average basis, was at near all-time high levels, as of October 2024.
Comparing Bitcoin’s Annualized Energy Consumption
In this section, we compare Bitcoin’s annualized energy consumption to that of nations, the gold mining industry and Ethereum. The data was sourced from the Cambridge Centre for Alternative Finance.
| Crypto/Industry/Nations | Annualized energy consumption estimates as of November 20, 2024 | Percentage difference vs Bitcoin |
|---|---|---|
| China | 7805 TWH | +4334% |
| United States | 3979 TWH | +2160% |
| India | 1442 TWH | +719% |
| Bitcoin | 176.62 TWH | NA |
| Egypt | 168 TWH | -4.5% |
| Poland | 158 TWH | -10.2% |
| Malaysia | 150 TWH | -14.7% |
| Gold mining | 131 TWH | -23.9% |
| Ethereum | 5.50 Gigawatt hours (GWH) | -99.99% |
How Is Bitcoin Mining Energy Consumption Estimates Calculated?
According to Digiconomist, Bitcoin mining energy estimates are calculated on the premise that miner income and costs are related.
“To put it simply, the higher mining revenues, the more energy-hungry machines can be supported,” said Digiconomist.
The steps and assumptions used to determine Bitcoin’s energy consumption were as follows:
- Calculate total mining revenues.
- Estimate what part of mining revenue is spent on electricity. Digiconomist assumes miners will spend 60% of their revenues on operational costs on average in equilibrium.
- Find out how much miners pay per KWH. Digiconomist assumes that for every 5 cents spent on operational cost 1 KWH was consumed.
- Convert costs to consumption.
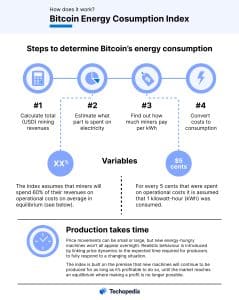
Source: bitcoinenergyconsumption.com
Bitcoin’s Sustainability Approach: Bitcoin Mining Green Energy Stats
Data on Bitcoin electricity consumption by source compiled by Cambridge Centre for Alternative Finance showed the Bitcoin mining industry’s reliance on coal as an energy source has decreased with time.
Coal – considered the dirtiest of all energy sources – saw its share in Bitcoin’s energy supply mix reduce from a peak of 51.9% in February 2020 to 36.55% by January 2022.
The ban on Bitcoin mining in China in May 2021 saw the energy share derived from coal drop to a low of 26.65% in July 2021.
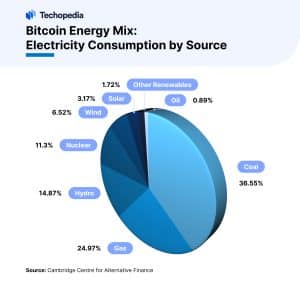
At the time of writing, Cambridge Centre for Alternative Finance did not publish Bitcoin electricity consumption by source beyond January 2022. The research firm’s latest data from January 2022 showcase the following energy mix for Bitcoin monthly electricity consumption by source:
- Coal – 36.55%
- Gas – 24.97%
- Hydro – 14.87%
- Nuclear – 11.3%
- Wind – 6.52%
- Solar – 3.17%
- Other Renewables – 1.72%
- Oil – 0.89%
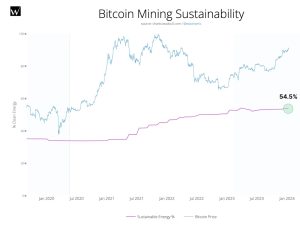
Meanwhile, Daniel Batten, managing director of Bitcoin ecosystem investment firm CH4 Capital and author of The Bitcoin ESG Forecast wrote in a January 2024 note that the Bitcoin mining industry is the only major global industry to be powered mostly by sustainable energy.
Batten added that the ban on mining in China and the “effective ban in Kazakhstan” has forced miners to move to greener grids in North America or to sustainable off-grid sites.
According to Batten, the Bitcoin mining industry is using more sustainable energy than ever before, with the share of “sustainable mining” hitting an all-time high of 54.5% in 2023.
Bitcoin Mining Industry’s Greenhouse Gas Emission Stats
The process of producing energy by burning fossil fuels emits greenhouse gasses into the Earth’s atmosphere. Therefore, the Bitcoin mining industry’s enormous energy consumption has prompted environmentalists to highlight the industry’s carbon footprint.
An October 2024 report published by Advancing Earth and Space Sciences noted that the Bitcoin mining industry emitted 85.89 metric tonnes (Mt) of carbon dioxide equivalent (CO2 eq) during the 2020-2021 period, which was said to be equivalent to the emission caused by burning 84 billion pounds of coal or running 190 natural gas-fired power plants.
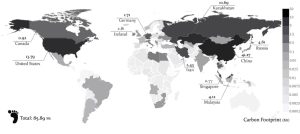
The report retrieved greenhouse emission data from the Cambridge Centre for Alternative Finance. The research firm assessed Bitcoin’s carbon footprint from September 2019 to January 2022.
Bitcoin Mining Industry’s Water Footprint Stats
Advancing Earth and Space Sciences’ October 2023 report noted that between 2020 and 2021, the global water footprint of the Bitcoin mining industry was about 1.65 cubic kilometers (km3).
According to the report, the Bitcoin mining industry’s water usage during the period was more than the domestic water use of 300 million people in rural Sub-Saharan Africa.
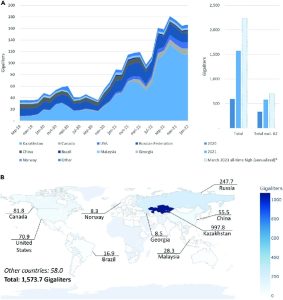
According to the report by Alex de Vries, founder of Digiconomist, as of January 26, 2024, the water footprint of Bitcoin in 2021 significantly increased by 166% compared with 2020, from 591.2 to 1,573.7 gigalitre (GL).
The water footprint per transaction processed on the Bitcoin blockchain for those years amounted to 5,231 and 16,279 L, respectively.
As of 2023, Bitcoin’s annual water footprint may equal 2,237 GL.
When compared to the gold mining industry, a 2021 research report by Simon Meissner of Universität Augsburg reported that 79.7% of global gold production in 2018 was estimated to consume 712.79 cubic megameters (Mm3) of water.
Bitcoin Mining Industry’s Noise Pollution Stats
Bitcoin miners are facing protests from neighbors due to noise pollution caused by the mining rigs, as reported by DL News in February 2024.
In the news report, residents of Granbury, Texas, voiced their complaints about Bitcoin mining company Marathon Digital’s facility housing about 80,000 mining rigs that “generates a noise like the inside of a wind tunnel.”
According to Bitcoin Magazine, a single Bitcoin mining rig produces between 70 to 90 decibels (dB) of sound.
For reference, a power mower produces 96 dB of sound while a passenger car at 65 miles per hour at 25 feet produces 77dB of sound, said iac acoustics in a blog.
How Is the Bitcoin Mining Industry Aiding the Growth of the Renewable Energy Sector?
According to advisory services firm KPMG, the variable nature of renewable energy sources – wind and solar in particular – incentivizes facilities to produce at their maximum capacity to deliver energy in a consistent manner.
This approach to energy generation often leads to an excess supply of electricity and a supply-demand mismatch, ultimately resulting in low or negative renewable energy prices.
Meanwhile, the highly competitive nature of Bitcoin mining forces miners to constantly search for the lowest cost of electricity, which is often tied to under-utilized hydro, wind and solar power generating stations.
Bitcoin mining’s constant demand for electricity makes it a “last resort” buyer of renewable energy when demand is low, said KPMG.
Bitcoin Mining and Energy Consumption Stats of the World’s Largest Bitcoin Mining Companies
In this section, we highlight Bitcoin mining stats related to the top five largest publicly-listed Bitcoin mining companies in the world.
| Name | Market Cap | FY23 Revenue | FY23 Net Profit/Loss | Hashrate | Sustainable Energy Share in Energy Supply Mix | Source |
|---|---|---|---|---|---|---|
| Marathon Digital (MARA) | $6.39 billion | $387.5 million | +$261.2 million | 40,200 peta hash per second (PH/S), as of November 2024 | 55% (As of December 31, 2023) | 10-K |
| CleanSpark (CLSK) | $3.65 billion | $168.4 million | -$136.6 million | 31,300 PH/S, as of November 2024 | Non-carbon energy used in location:
|
10-K Hashrate index |
| Phoenix Group (PHX) | $2.24 billion | $288.2 million | +$220.9 million | 12,900 PH/S, as of Q3 2024 | Undisclosed | Annual report Quarterly report |
| Riot Blockchain (RIOT) | $3.14 billion | $280.6 million | – $49.5 million | 29,400 PH/S, as of November 2024 | Undisclosed | 10-K Hashrate index |
| Cipher Mining (CIFR) | $1.34 billion | $126.8 million | -$25.8 million | 10,700 PH/S, as of November 2024 | Undisclosed | 10-K Hashrate index |
Geographic Locations of Bitcoin Miners
Cambridge Centre for Alternative Finance studied the Bitcoin mining industry between September 2019 and January 2022. According to their studies, the top 10 Bitcoin mining nations were:
| Rank | Nation | Hash Rate, as of January 2022 |
|---|---|---|
| 1 | United States | 37.8% |
| 2 | China | 21.1% |
| 3 | Kazakhstan | 13.2% |
| 4 | Canada | 6.5% |
| 5 | Russia | 4.7% |
| 6 | Germany | 3.1% |
| 7 | Malaysia | 2.5% |
| 8 | Singapore | 2% |
| 9 | Ireland | 2% |
| 10 | Thailand | 1% |
| – | Rest of the world | 6.3% |
Top Bitcoin Mining Pools by Hash Rate
A Bitcoin mining pool refers to a group of miners that consolidate their computing resources to increase their chance of building Bitcoin blocks and receiving block rewards in return.
Bitcoin mining pools are popular as they provide consistent returns to miners.
Bitcoin data compiled by the Chain Bulletin listed the top Bitcoin mining pools by hash rate as of November 20, 2024.
| Rank | Pool | 14-Day Hash Power | Percentage of Global Hash Rate |
|---|---|---|---|
| 1 | Foundry USA Pool | 232.36 exahashes per second (EH/s) | 31.9% |
| 2 | AntPool | 161.72 EH/s | 22.2% |
| 3 | ViaBTC | 94.38 EH/s | 13% |
| 4 | F2Pool | 70.86 EH/s | 9.7% |
| 5 | Unknown | 70.65 EH/s | 9.7% |
| 6 | SecPool | 26.77 EH/s | 3.7% |
| 7 | Binance Pool | 17.24 EH/s | 2.4% |
| 8 | SlushPool | 12.67 EH/s | 1.7% |
| 9 | Luxor | 10.02 EH/s | 1.4% |
| 10 | SBI Crypto | 7.45 EH/s | 1% |
State of the Bitcoin Mining Industry in the US
Here are some interesting statistics about the Bitcoin mining industry in the US:
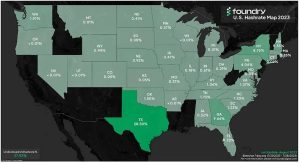
- Texas was the top Bitcoin mining state in the USA in 2023, boasting 28.5% of the North American hash rate. (Source: Foundry)
- Texas overtook Georgia for the top spot. The latter saw its share of North American hash rate drop from 34.2% in 2021 to 9.6% by July 2023. (Source: Foundry)
- According to KPMG, Texas produces more renewable energy than any other US state, making it a popular destination for Bitcoin miners.
- Foundry data showed Idaho, Alaska, California, Arizona, New Mexico, Louisiana, Mississippi, West Virginia, New Jersey, Delaware, Vermont, Maine and Hawaii contributed zero or negligible hash rate.
- US Energy Information Administration (EIA) estimated that the US crypto mining industry represented 0.6% to 2.3% of the nation’s annual electricity consumption.
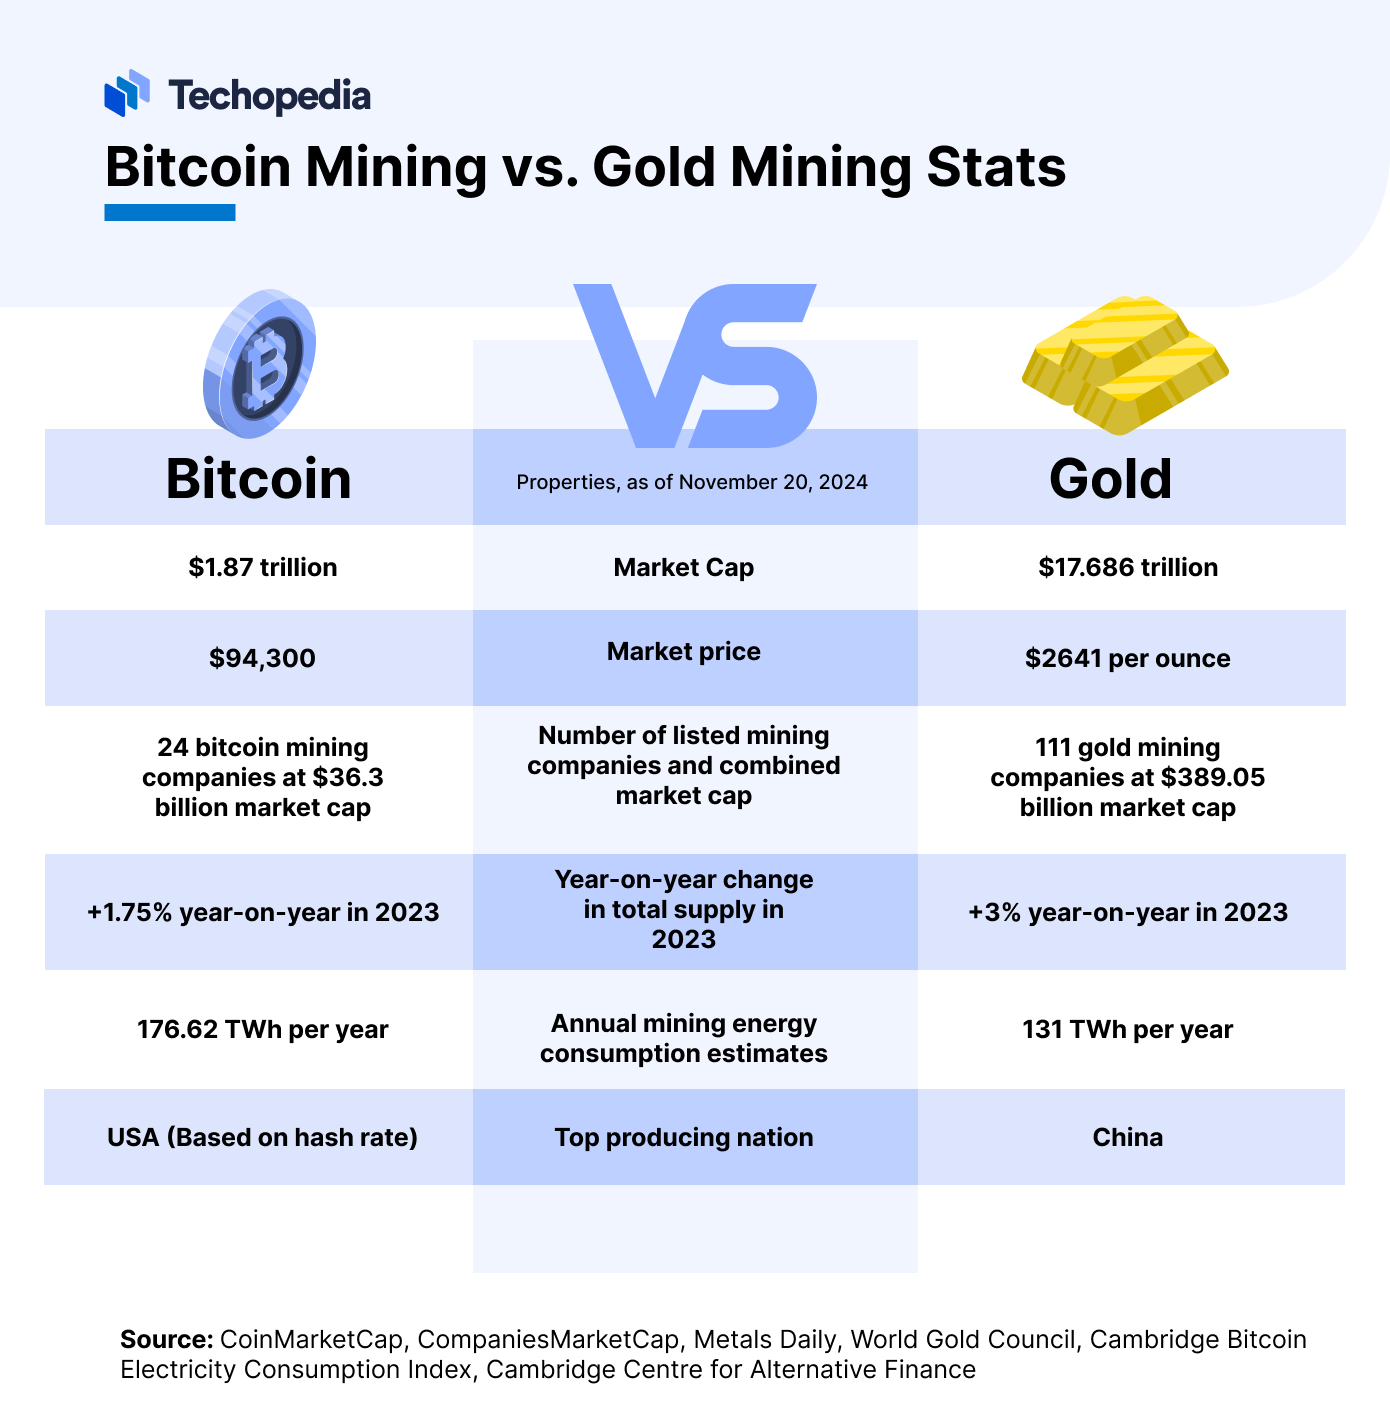
Bitcoin Mining vs Gold Mining Stats
Bitcoin and gold are often comparable with one another for their limited supply, inflation-hedge properties and energy-intensive mining processes. Bitcoin’s pseudonymous founder Satoshi Nakamoto compares the two assets in the Bitcoin white paper:
“The steady addition of a constant of amount of new coins is analogous to gold miners expending resources to add gold to circulation. In our case, it is CPU time and electricity that is expended.”
In the table below, we compare interesting metrics for Bitcoin and gold:
Technical Bitcoin Mining Stats
We will end this Bitcoin mining and energy consumption statistics article on a technical note. Let’s go through some technical information and stats:
Hash Rate
Hash rate is one of the most important Bitcoin mining metrics. It measures the estimated number of SHA256 computations performed by all miners every second.
A higher hash rate indicates more mining rigs in operation. It is a key metric to estimate Bitcoin energy consumption stats.
Blockchain.com data showed Bitcoin’s total hash rate hitting an all-time high of 755.5 EH/s in November 2024.
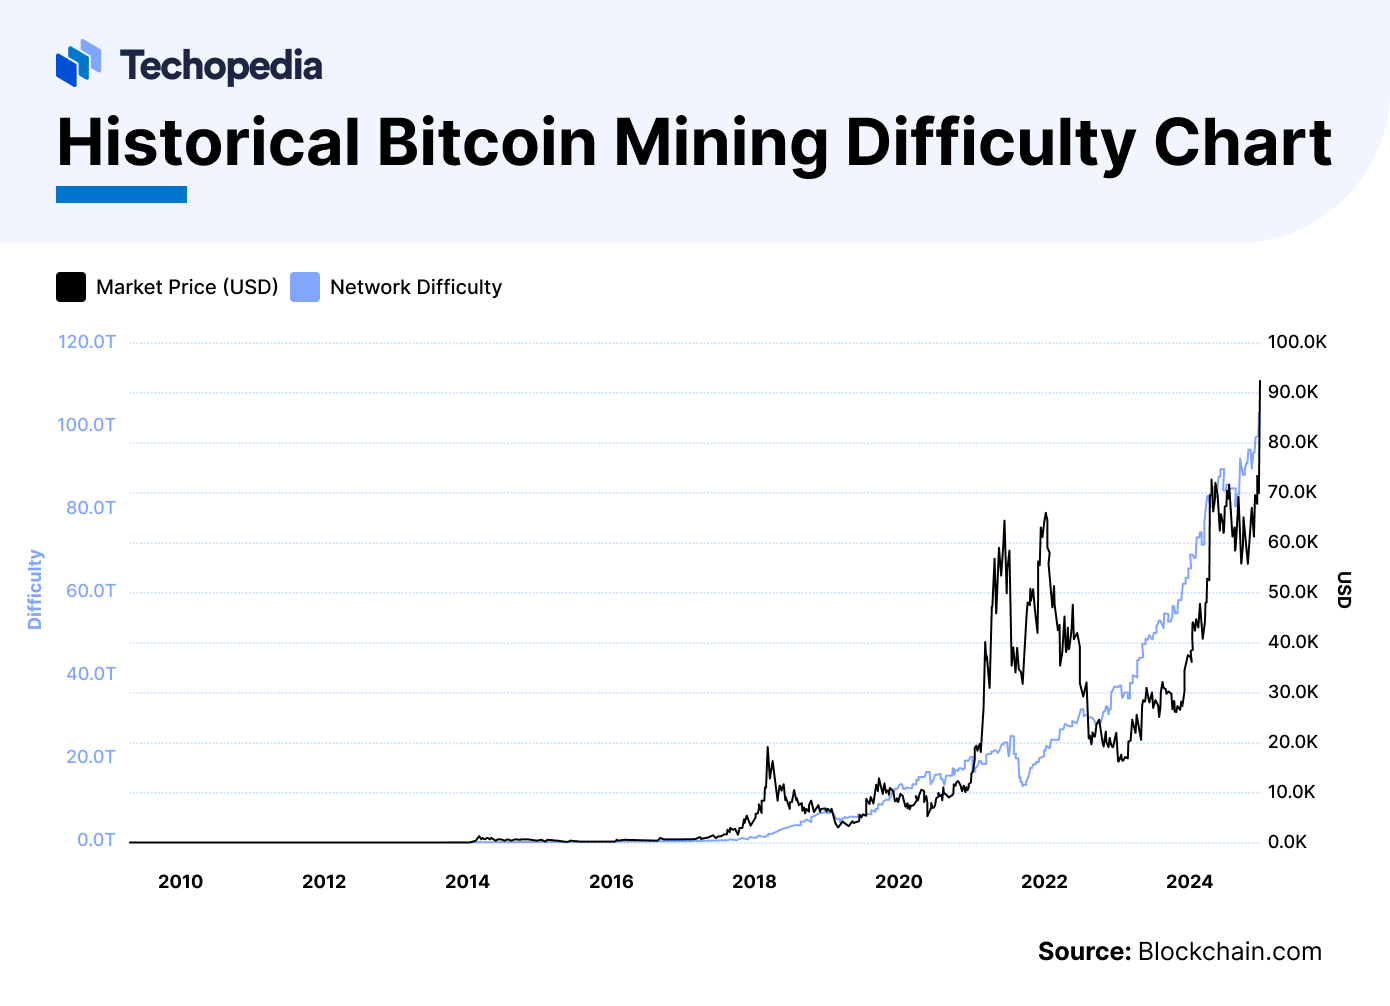
Mining Difficulty
Mining difficulty refers to the complexity of puzzles that Bitcoin miners must solve to get the chance to create the next block and earn block rewards.
Bitcoin’s mining difficulty is a self-regulating algorithm that increases in difficulty when more miners are online and decreases as miners leave the network. Mining difficulty ensures that Bitcoin blocks are always created at a 10-minute interval no matter how much mining power is online.
According to blockchain.com, the mining difficulty reached a new all-time high of 102.28 trillion in November 2024.
Blockchain Rewards
Block rewards refer to the amount of new-minted Bitcoins paid to the miner that creates a new block.
As of November 2024, Bitcoin miners were rewarded 3.125 BTC per block.
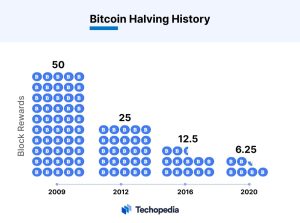
Bitcoin Halving
Halving refers to an event that reduces block rewards by half. The halving occurs every 210,000 blocks (roughly every four years).
The BTC halving events impact both investors and miners.
The Bottom Line
Bitcoin mining energy consumption has become a subject of significant interest and scrutiny. As the popularity and value of Bitcoin (BTC) have surged, so has the energy required to mine new coins and maintain the blockchain.
Whether you’re a seasoned investor or new to the cryptocurrency landscape, discovering the ins and outs of Bitcoin mining is a must to grasp the true potential of this digital asset.
FAQs
Does Bitcoin mining actually pay?
How long does it take to mine $1 of Bitcoin?
How do I start Bitcoin mining?
Is Bitcoin mining profitable?
References
- Bitcoin Mining by Country 2024 (Worldpopulationreview)
- Breaking BFT: Quantifying the Cost to Attack Bitcoin and Ethereum (ssrn)
- Cambridge Blockchain Network Sustainability Index: CBECI (Ccaf)
- Cambridge Blockchain Network Sustainability Index: CBECI: Comparisons (Ccaf)
- Bitcoin Energy Consumption Index – Digiconomist (Digiconomist)
- Cambridge Blockchain Network Sustainability Index: Bitcoin GHG Emissions (Ccaf)
- Issue #003: One red, three green – by Daniel Batten (Batcoinz)
- The Environmental Footprint of Bitcoin Mining Across the Globe: Call for Urgent Action (Agupubs.onlinelibrary.wiley)
- Bitcoin’s growing water footprint (Cell)
- The Impact of Metal Mining on Global Water Stress and Regional Carrying Capacities—A GIS-Based Water Impact Assessment (Researchgate)
- Angry Texans fight Bitcoin mine’s 80,000 noisy machines in test for industry – DL News (Dlnews)
- Solving Bitcoin Mining Noise Pollution – Bitcoin Magazine – Bitcoin News, Articles and Expert Insights (Bitcoinmagazine)
- Comparative Examples of Noise Levels – IAC Acoustics (Iacacoustics)
- The Impact of Metal Mining on Global Water Stress and Regional Carrying Capacities—A GIS-Based Water Impact Assessment (Kpmg)
- United States Securities and Exchange Commission Washington, d.c. 20549 Form 10-K (Ir.mara)
- Bitcoin Mining Stocks Market (Data.hashrateindex)
- United States Securities and Exchange Commission Washington, d.c. 20549 Form 10-Kunited States Securities and Exchange Commission Washington, d.c. 20549 Form 10-K (Investors.cleanspark)
- Investor Relations | Phoenix Group (Phoenixgroupuae)
- Fhoenix Financial Q3 Results 2024 (Phoenixgroup)
- Unitedstates Securities Andexchangecommission Washington, d.c. 20549 FORM10-K (S3.amazonaws)
- United States Securities and Exchange Commission Washington, d.c. 20549 Form 10-K (Investors.ciphermining)
- Cambridge Blockchain Network Sustainability Index: Mining Map: Visualisation (Ccaf)
- Bitcoin Mining Map – Bitcoin Network Data on a World Map (Chainbulletin)
- Foundry USA Pool Hashrate by State | by Foundry | Foundry | Medium (Medium)
- Tracking electricity consumption from U.S. cryptocurrency mining operations –
U.S. Energy Information Administration (EIA) (Eia) - Bitcoin: A Peer-to-Peer Electronic Cash System (Bitcoin)
- Be early to the future of finance (Blockchain)
- Blockchain.com | Charts – Total Hash Rate (TH/s) (Blockchain)
- Blockchain.com | Charts – Network Difficulty (Blockchain)