
Getting the hang of Excel can make a big difference in how quickly and easily you get things done. Learning basic Excel tips and tricks for beginners that help organize your data all the way to advanced Excel “magic” for analyzing large datasets will make your life a lot easier in the long run.
So, how to use Microsoft Excel effectively? By the end of this guide, you’ll be able to navigate Excel with confidence and get more done in less time.
Key Takeaways
- Organizing your data efficiently with features like Tables, Filters, and Sorting can save you time and reduce mistakes in Excel.
- Visualizing data with Charts, Graphs, PivotTables, and Sparklines makes it easier to spot trends and analyze large datasets.
- Advanced functions like VLOOKUP, XLOOKUP, and IF help you manage and manipulate complex data with ease.
- Tools like Goal Seek, Solver, and Power Query streamline data analysis and problem-solving in Excel.
- Using Error Checking, Track Changes, and AutoSave ensures data accuracy and recovery, protecting your work from errors and unexpected issues.
15 Best Excel Tips and Tricks in 2026
Ready to elevate your Microsoft Excel game? Here are some of the best Excel tips and tricks that you should know.
Excel Tips for Better Organization
Keeping your data organized in Excel can save you a lot of time and help prevent mistakes. Here are a few practical tips that’ll make managing your spreadsheets easier.
1. Use Excel Spreadsheet Templates
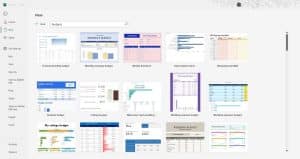
Excel has built-in templates for things like budgets and project tracking. Just go to File > New, find a template that works for you, and adjust the columns, formatting, and formulas as needed.
2. Organize Data With Filters and Sorting
If you’re working with a lot of data, sorting and filtering will make your life a lot easier. To quickly sort data, click the column header and choose ascending or descending.
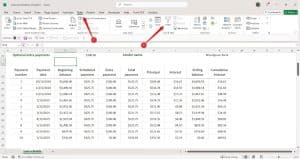
Filters are great when you want to focus on specific data. You can find the Filter button under the Data tab, which lets you display only the rows that match certain criteria.
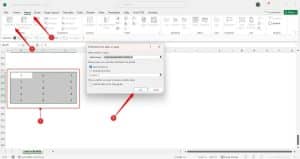
3. Data Validation for Consistency
Data validation helps keep your entries consistent by restricting what can be entered in a cell.
Go to Data > Data Validation and set the rules to prevent mistakes and maintain consistency.
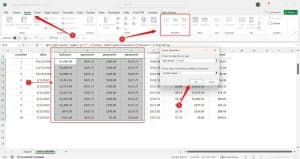
4. Use Tables for Easy Data Management
Turning your data into a table makes it much easier to work with. Tables let you filter, sort, and format your data all in one go.
To do this, select your data, go to the Insert tab, and hit Table. Excel will automatically format it and add some handy features like filtering.
Data Analysis and Visualization Tips
Working with data is a lot easier when you can break it down and visualize it. Here are some simple Excel tricks and tips to help you turn your numbers into clear, easy-to-read insights using Excel’s built-in tools.
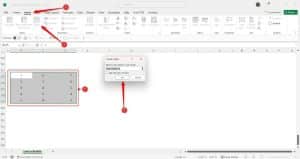
5. Create Charts and Graphs
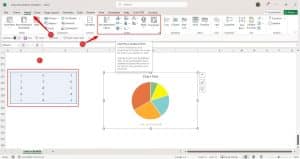
Charts and graphs make it easier to see patterns in your data. Just highlight the data you want to visualize, head to the Insert tab, and pick a chart type like bar, line, or pie. It’s a quick way to turn numbers into something visual and easier to understand.
6. PivotTables for Quick Data Analysis
PivotTables are perfect for summarizing large sets of data. Select your data, go to Insert, and click PivotTable.
You can then drag and drop fields to arrange your data however you need, making it easy to spot trends or totals without altering your original data.
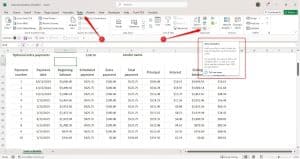
7. Conditional Formatting for Highlighting Key Information
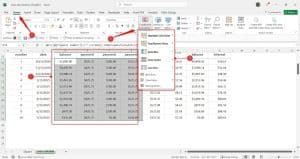
Conditional formatting helps you highlight important info automatically. Select your data, go to the Home tab, and click Conditional Formatting.
Set up rules so Excel highlights cells based on values or ranges—for example, automatically shading the highest numbers.
8. Use Sparklines for Quick Data Visualization
Sparklines are tiny, in-cell charts that show data trends in a single cell. Select your data, go to Insert, and choose Sparklines. You can choose between line, column, or win/loss styles to quickly see patterns without taking up much space.
Advanced Excel Tips & Tricks
For those more complex tasks in Excel, these advanced tools can help you handle big datasets, analyze details, and automate time-consuming processes.
9. VLOOKUP and XLOOKUP
VLOOKUP lets you find a value in one column and return data from another column in the same row. XLOOKUP is more flexible, allowing you to search in any direction, making it better for big spreadsheets.
- VLOOKUP: Select the column with the data you want to search, then specify which column to pull data from.
- XLOOKUP: Same process as VLOOKUP, but it works in any direction—across rows or columns.
10. Advanced Formulas and Functions
The IF function helps you run logical tests and return results based on conditions. SUMIF and COUNTIF are great for adding up or counting values that meet specific criteria, making data analysis quicker.
- IF: Use the formula =IF(condition, value_if_true, value_if_false) to perform logical tests.
- SUMIF and COUNTIF: Use these formulas to sum or count cells based on specific conditions like =SUMIF(range, criteria, [sum_range]).
11. Goal Seek and Solver for Data Analysis
Goal Seek helps you figure out what input you need to get a specific result, while Solver tackles more complex problems with multiple variables. Both tools are great for analyzing different scenarios and making decisions.
- Goal Seek: Go to Data > What-If Analysis > Goal Seek, then set the target value, and the cell Excel should change to reach it.
- Solver: Enable Solver from File > Options > Add-ins, then go to Data > Solver to define your problem and constraints.
12. Power Query for Data Transformation
Power Query automates importing and cleaning data, making it easy to merge and reshape large datasets without doing everything manually.
- Power Query: Go to Data > Get Data to import data from various sources, then use the Query Editor to clean, merge, and reshape your data automatically.
Error Prevention and Troubleshooting Tips
Excel has some useful tools to help catch mistakes and keep your data safe. Here’s a quick look at how you can use them to avoid issues and fix problems as they come up.
13. Error Checking and Auditing Tools
Use Excel’s Error Checking in the Formulas tab to quickly spot formula issues.
Trace Precedents and Trace Dependents help you see which cells are linked so you can figure out where things might be off.
14. Tracking Changes and Using Comments
Turn on Track Changes in the Review tab to keep an eye on edits. Comments let you leave notes in cells, making it easier to explain changes when working with others.
15. Data Recovery and AutoSave Features
AutoSave saves your work automatically, and AutoRecover helps you get it back if something crashes. Make sure they’re turned on by going to File > Options > Save.
Excel Tips and Tricks Cheat Sheet
Still, the list of useful tricks and tips won’t be full without the top Excel shortcuts, which will enable you to get things done much faster.
The Bottom Line
Knowing the basics of Excel and the right Excel tips and tricks can make a big difference in how quickly and accurately you work. Features like VLOOKUP, PivotTables, and Conditional Formatting make it easier to manage and analyze your data.
Master these skills, and you’ll be able to get things done faster and more efficiently in 2024 and beyond.